Problem
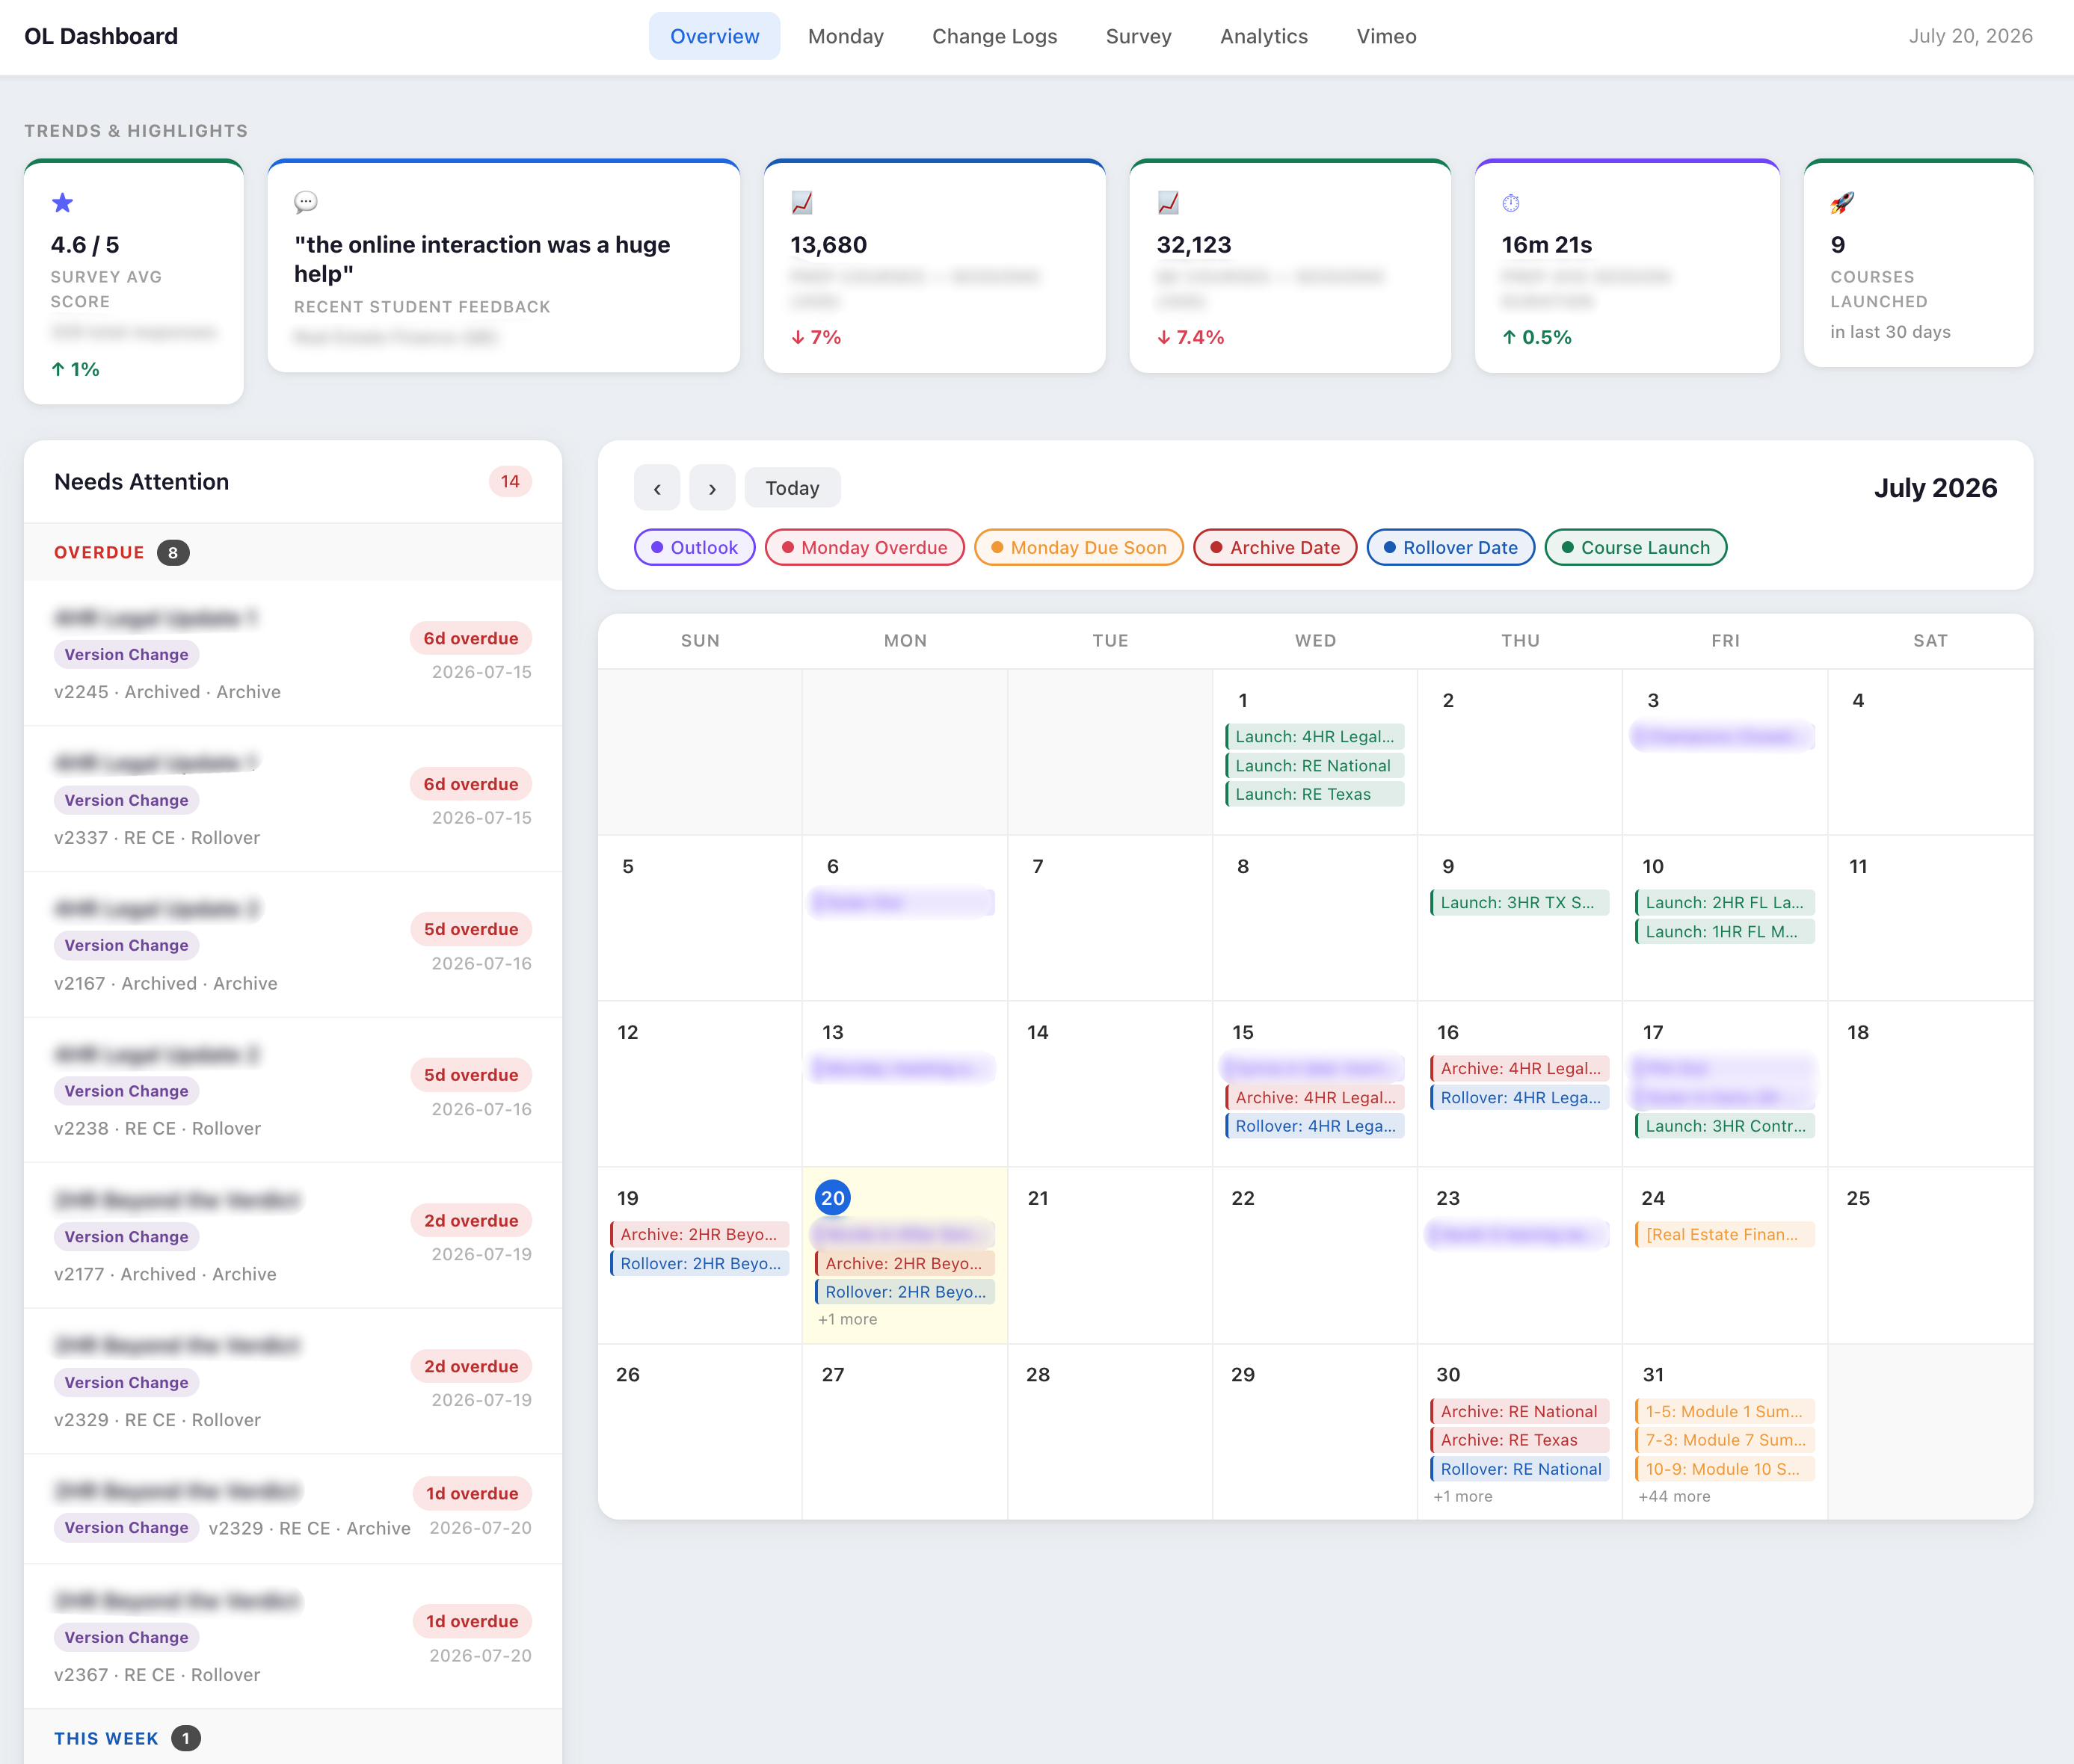
Managing 30+ courses meant tracking archive dates, rollover schedules, version changes, learner survey sentiment, traffic, and video engagement across six separate systems by hand. Nothing lived in one place, and it was easy for something small — an overdue archive date, a course that needed a version bump — to slip through until it became a bigger problem.
Approach
Designed and built a full-stack operations dashboard from scratch that pulls live data from Google Analytics, Google Sheets, Monday.com, Vimeo, and Outlook calendars into one view. I worked with Claude as a development partner to move from concept to production faster, while I directed the architecture, data model, and what the dashboard actually needed to surface. Each integration follows the same pattern (fetch, normalize, cache) so adding a new data source doesn't mean reinventing anything. The home view goes a step further than just displaying that data: it recombines survey results, analytics, and Monday activity into derived insights by flagging what needs attention, scoring comment sentiment, and surfacing trend deltas so the dashboard interprets the data instead of just reporting it. It's deployed on Render with a Google Cloud-backed pipeline, so it runs on its own and stays current without manual upkeep.
Impact
- One dashboard instead of six open tabs to check the status of any course
- Overdue tasks and compliance-related deadlines get caught before they become a fire drill
- Gives leadership visibility into course health, traffic, and learner sentiment without needing a status update from me
React 18 / Vite
Node.js / Express
Render
Google Cloud
Google Analytics (GA4) API
Google Sheets API
Monday.com API
Vimeo API
Outlook / ICS
Claude (AI-assisted development)